Firm Returns Vs The Competitors
Before discussing returns, it’s important to make one thing clear: every investment manager chooses their own strategy. That strategy reflects their investment thesis and where they believe the market is headed. They could have chosen any approach, but they selected the one they believed in. Below you will be able to see how our firm’s approach did compared to the opps/competition.
My Returns vs. My Peers
My returns as of 12/31/2025: 21.51% net of fees
S&P 500 YTD returns: 17.98%
All capital at the firm is currently 100% risk-on. We outperformed the S&P 500 by 3.53%.
Portfolio Metrics 2025
Sharpe Ratio: 2.91
Alpha: 0.85
How should you interpret this data? Our risk management is great and our pick of investments is beating the benchmarks and providing meaningful value to investors.
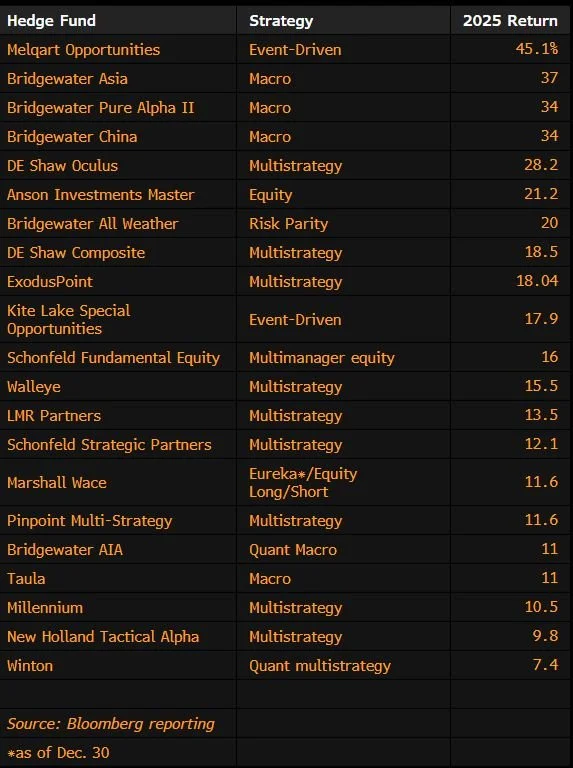
Peer Comparisons
Average hedge fund returns: 10–11%
Source: Alternatives WatchURL: https://www.alternativeswatch.com/2025/12/23/hedge-fund-returns-allocator-activity-increase-in-2025/
Smaller hedge funds (< $100M AUM): 14.6%
Source: Business InsiderURL: https://www.businessinsider.com/small-hedge-funds-out-performed-peers-2025-12?utm_
Dymon Asia: 15%
Source: Financial News LondonURL: https://www.fnlondon.com/articles/hedge-fund-dymon-asias-2025-returns-hit-15-014d5808
Equity-focused hedge funds: 17.1%
Source: HedgeweekURL: https://www.hedgeweek.com/hedge-funds-on-track-for-best-year-of-the-decade/?utm_
Select hedge fund returns:
BoothBay: 16.4%
AQR: 16.2%
ExodusPoint: 15.6%
Balyasny: 15.3%
Point72: 15.3%
Walleye: 13.1%
Pinpoint Asset Management: 10.4%
Schonfeld Partners: 10.0%
LMR: 8.9%
Citadel Wellington: 8.3%
Millennium: 8.3%
Jain Global: 2.2%
Source: Business Insider
URL: https://www.businessinsider.com/hedge-fund-performance-november-citadel-balyasny-exoduspoint-2025-12?utm_
Extra Section
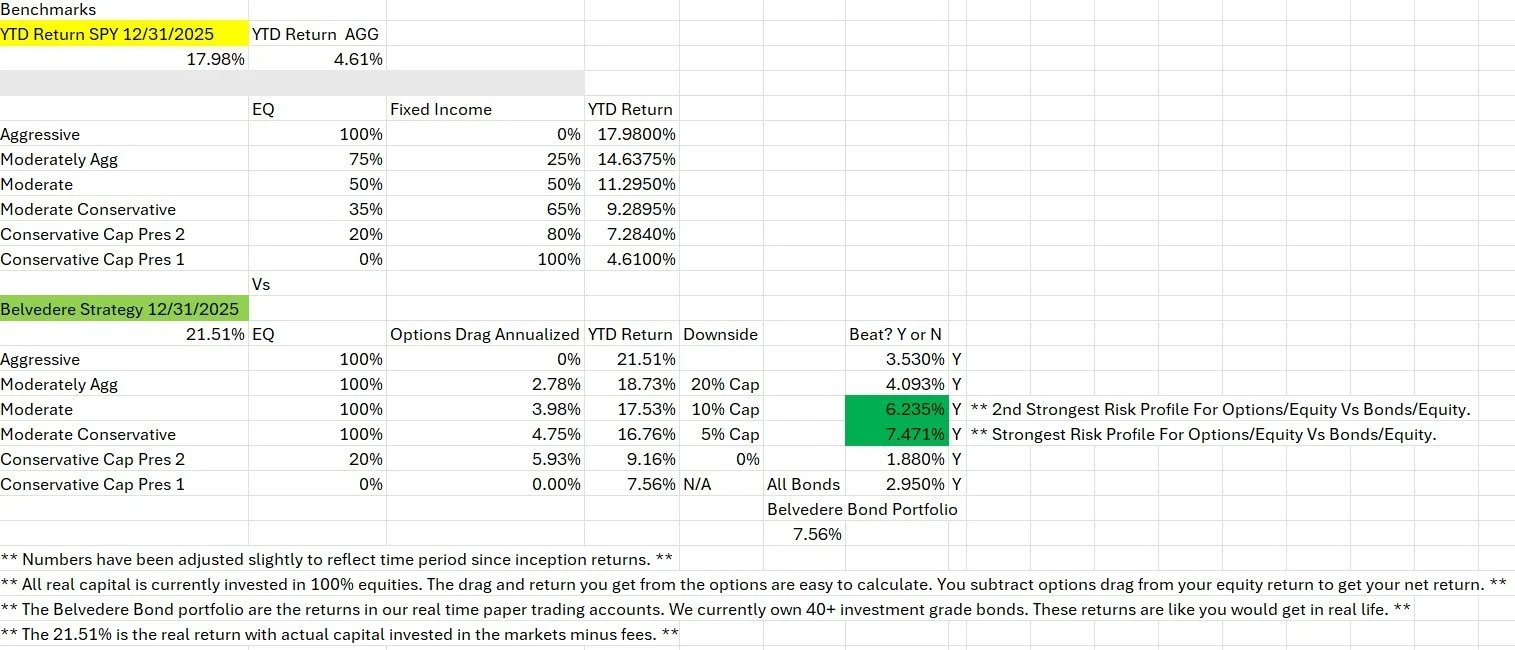
Please review the image above carefully for context. We outperformed the benchmark by 3.53% percent in 2025.
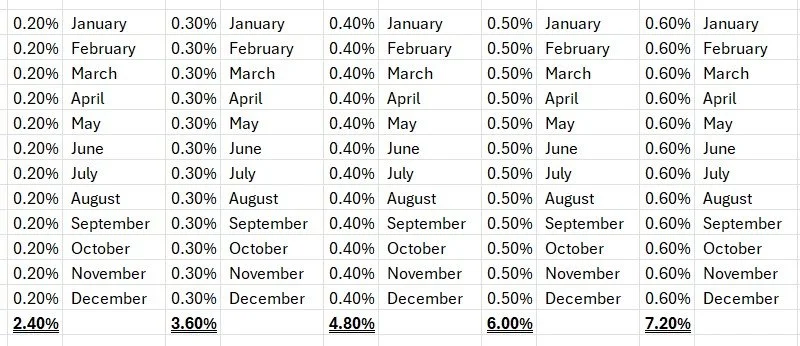
Drag Reduction/Return Boosting Info
Below are some examples of how much we can reduce the drag per month. We will write high probability covered calls/credit spreads that reduce the cost of your insurance (PUT options). We can generate between 0.20%-0.60% monthly doing this. Everything we do when it comes to writing covered calls is based on probability and market conditions. For example if we had a huge sell off like we had in March/April of 2025 that is a scenario where we would most likely not write covered calls or credit spreads. In normal and predictable markets this is where credit spread writing and covered call writing shines. If the drag on your portfolio is 4% there is a real possibility depending on market conditions that we could essentially eliminate the hedge cost though a disciplined statistical based options strategy.
The way I think about it is like this…If you had $100,000,000 in the market with this strategy and we earned you anywhere between 2.40% and 7.20% over the course of the year who would not want 2.4 to 7.2 million extra dollars in their account? That is how I think about this. Its free money essentially that many people are missing out on, even at active managers.
Back Tests SPY
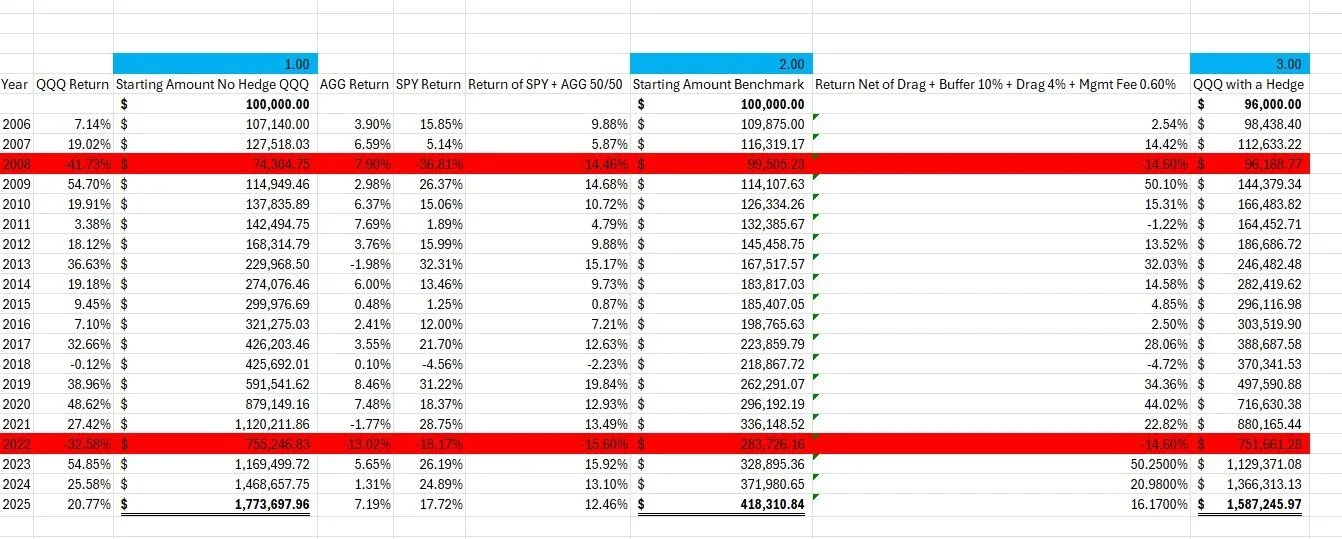
I conducted a manual back test that incorporated portfolio drag and a 0.60% management fee, which was fully deducted from SPY returns. Based on this analysis, the strategy outperformed a traditional 60/40 portfolio approximately 70% of the time.
Notably, this back test did not include the 10% downside buffer that would have been in place during 2022. Had that protection been implemented, the strategy would likely have delivered a benchmark-beating year during that period as well.
In addition, the results do not account for covered call writing. Incorporating covered calls could further enhance returns while partially or fully offsetting the cost of downside protection.
For investors using a 50/50 equity–bond allocation rather than a traditional 60/40 mix for a moderate risk profile, this strategy may prove even more effective.
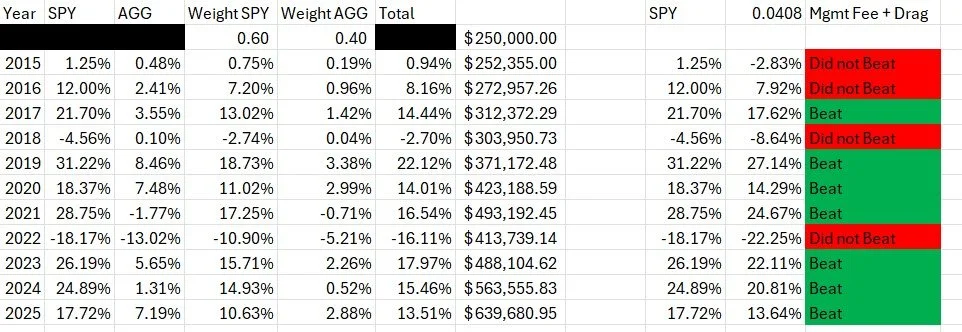
Here ^ is the SPY Hedged manual back test. Check out our other blog post (below is a screenshot) on the QQQ manual back test or just go to the link: https://www.belvedereinvestmentsco.com/blog/back-tested-strategies
No covered call writing done here either, clients that don’t want to accept the risk of their shares being called away can just be set up with the hedge.