Benchmarks We Measure Ourselves Against
We measure our success against custom benchmarks tailored to your specific risk profile. Each strategy aims to outperform a weighted blend of the S&P 500 (SPY) and the Bloomberg Aggregate Bond ETF (AGG).
Aggressive: 100% SPY (Approximate goal to beat: 10.00%)
Moderately Aggressive: 75% SPY & 25% AGG (Approximate goal to beat: 8.50%)
Moderate: 50% SPY & 50% AGG (Approximate goal to beat: 7.00%)
Moderately Conservative: 35% SPY & 65% AGG (Approximate goal to beat: 6.10%)
Conservative Capital Preservation II: 20% SPY & 80% AGG (Approximate goal to beat: 5.20%)
Conservative Capital Preservation I: 100% AGG (Approximate goal to beat: 4%)
Benchmark Disclosure: The target returns listed above are approximations based on historical market behavior. Our primary objective is to deliver alpha by outperforming a weighted benchmark of the S&P 500 (SPY) and the Bloomberg Aggregate Bond Index (AGG), customized to your specific risk tolerance and investment strategy.
Market Context & Performance Benchmarks
To understand our objectives, it is helpful to look at the broader landscape of "real-world" returns. While the market offers significant opportunities, consistent outperformance (Alpha) is notoriously difficult to achieve.
1. Market & Hedge Fund Benchmarks
The following figures represent historical averages across major asset classes and institutional strategies:
S&P 500 (Long-Term): 10.44% (Annualized)
S&P 500 (5-Year Trailing): 16.36% (Annualized)
Long/Short Equity Hedge Funds: 7% – 12%
Event-Driven / Distressed Debt Funds: 7% – 15%
2. The Outliers: Top-Performing Institutional Funds
Pershing Square Capital: 26.1% average annual return over five years.
Maverick Long Enhanced: 24.3% average annual return over five years.
Lone Pine Capital: 23.5% average annual return over five years.
Viking Global Equities: 22.6% average annual return over five years.
Haidar Jupiter Fund: 20.7% average annual return over five years.
3. Performance Philosophy: Probability Over Prediction
The returns highlighted above represent the pinnacle of institutional management. While these figures are impressive, they are the result of highly specialized strategies. My focus is not on chasing "outlier" returns through speculation, but on consistent, data-driven outperformance.
The Target: Capturing "Alpha"
Our objective is to outperform the S&P 500 by a margin of 1% to 5% annually. While this may sound modest compared to a top-tier hedge fund, compounding an extra 1–5% over the market average creates massive long-term wealth.
Why We Avoid the "Stock-Picking" Trap
History shows that long-term success through traditional stock picking is rare. Many investors fall victim to the "hubris of prediction"—the belief that they can consistently forecast a specific company’s quarterly performance.
The data suggests otherwise:
The Analyst Gap: Professional Wall Street analysts, despite their vast resources, have a historical forecasting success rate of only 47%
The Coin-Flip Reality: Statistically, relying on individual stock predictions is no more reliable than a coin flip.
Playing the Odds
We choose to play the odds rather than predict the players. I am less concerned with where a single stock like Apple will end up next quarter and more focused on what is statistically probable based on historical market behavior and our specific strategy.
Our Edge: We do not rely on the "perfect pick." We rely on a strategy that prioritizes high-probability outcomes and mathematical consistency over the uncertainty of market timing.
47% is basically a coin flip, I wouldn’t trust my capital to an analyst pick or even my own research for that matter if the goal is to beat the S&P 500 over the long term. The markets beat most managers. They are just to good. I prefer to focus on probabilities and historical performance over less statistically likely bets.
Data Sources
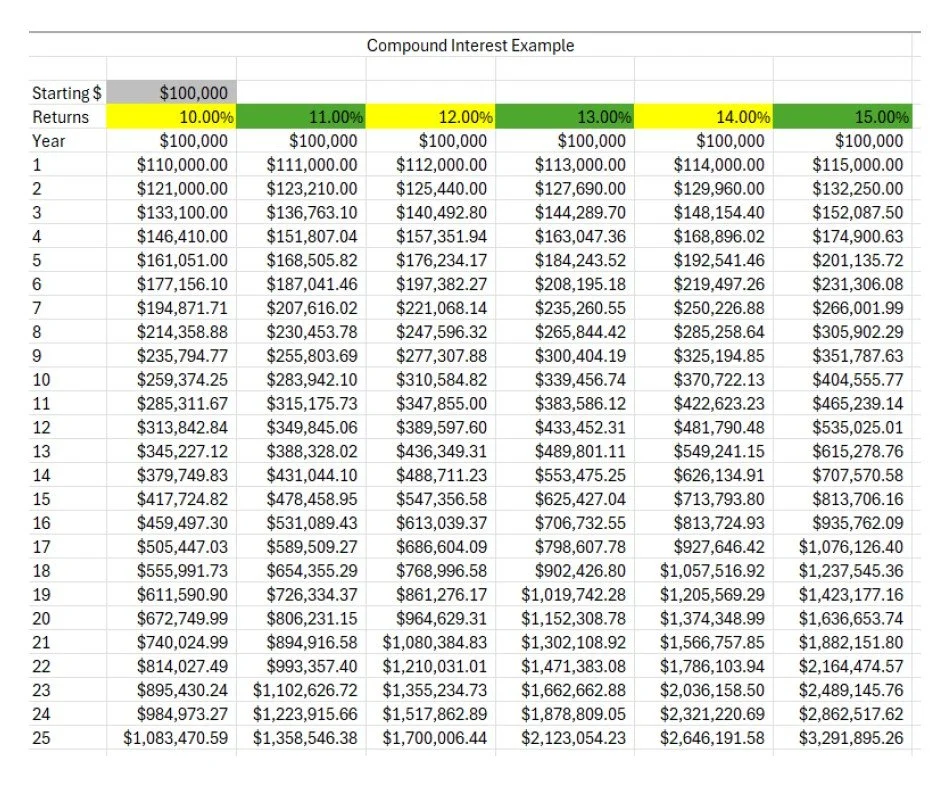
The Impact of Incremental Outperformance
The chart to the right illustrates the profound effect that even a small margin of "Alpha" (outperformance) can have over a long-term horizon. While the following figures are purely illustrative and intended for educational purposes, they demonstrate why our goal of exceeding market benchmarks is so vital.
The Value of "Plus 1–5%"
Assuming a baseline of 10% (the long-term historical average of the S&P 500) over a 25-year period, look at how a 1% to 5% increase in annual return changes the final outcome:
Annual Outperformance
1) +1% Return
2) +2% Return
3) +3% Return
4) +4% Return
5) +5% Return
Total Nominal Difference
1) $275,075
2) $616,535
3) $1,039,583
4) $1,562,720
5) $2,208,424
Inflation-Adjusted Value (2.5%)
1) $148,459
2) 332,899
3) $561,210
4) 843,839
5) $1,192,252