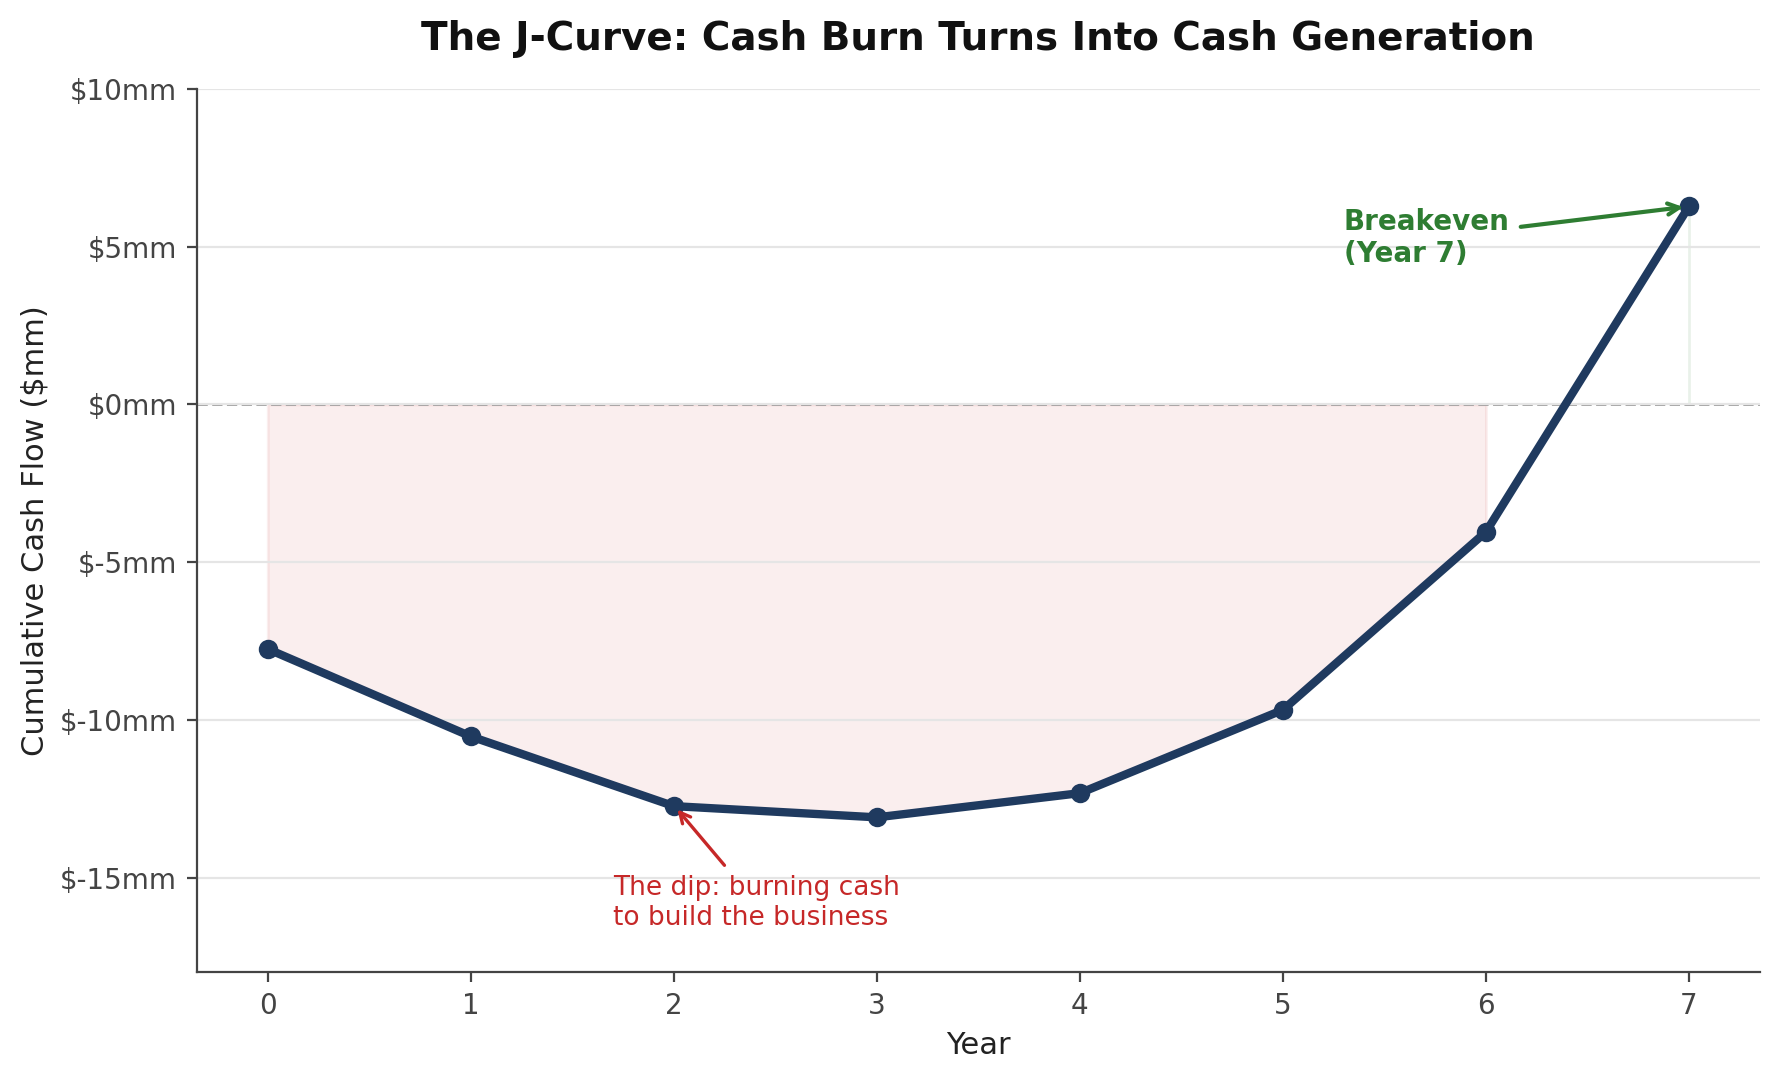
Not every valuation model you do out there is going to work with a traditional DCF model. High growth tech companies that are burning through cash require a slightly different method of analysis and review. VC investing deals with this a lot, high growth companies, starts ups/early stage, negative cash flow, operating expenses higher than revenue, etc. Here is a simplified model showing the classic J curve in VC investing. What turns the J curve model into an actual J is that your growth sustains in your revenue and continues to outpace your operational expenses. Year over year this compounds and you eventually escape the negative cash flow and the business turns into cash flow generating machine.
The Big Idea
A VC investment usually looks like a bad bet for years before it looks like a good one. You hand over cash, the company loses money while it builds its product and finds customers, and only years later does it turn a profit and become valuable. That losing-then-winning shape, plotted over time, looks like the letter "J", hence the "J-curve."
This model above walks through exactly that arc for a single hypothetical investment, year by year, so you can see how a $5 million check can turn into something worth 5-6x more.
The model has three simple building blocks
1. Assumptions, the inputs you control Everything starts here: how much you're investing, what % of the company you get, how fast revenue grows, how fast costs grow, and when you expect to sell (exit). Change any number here and everything downstream updates automatically. Think of this as the dashboard.
2. The J-Curve, what happens to the business each year This tab takes the assumptions and plays them forward year by year: revenue goes up, costs go up, and the difference between them is either a loss (early years) or a profit (later years). It also tracks the running total of cash burned or earned, that's the line that actually traces the "J" shape.
3. Returns, what it means for the investor This translates the company's growing value into what the investor actually walks away with: how many times their money they got back, and what annual return rate that works out to.
How a startup actually gets valued here (the part most people find confusing)
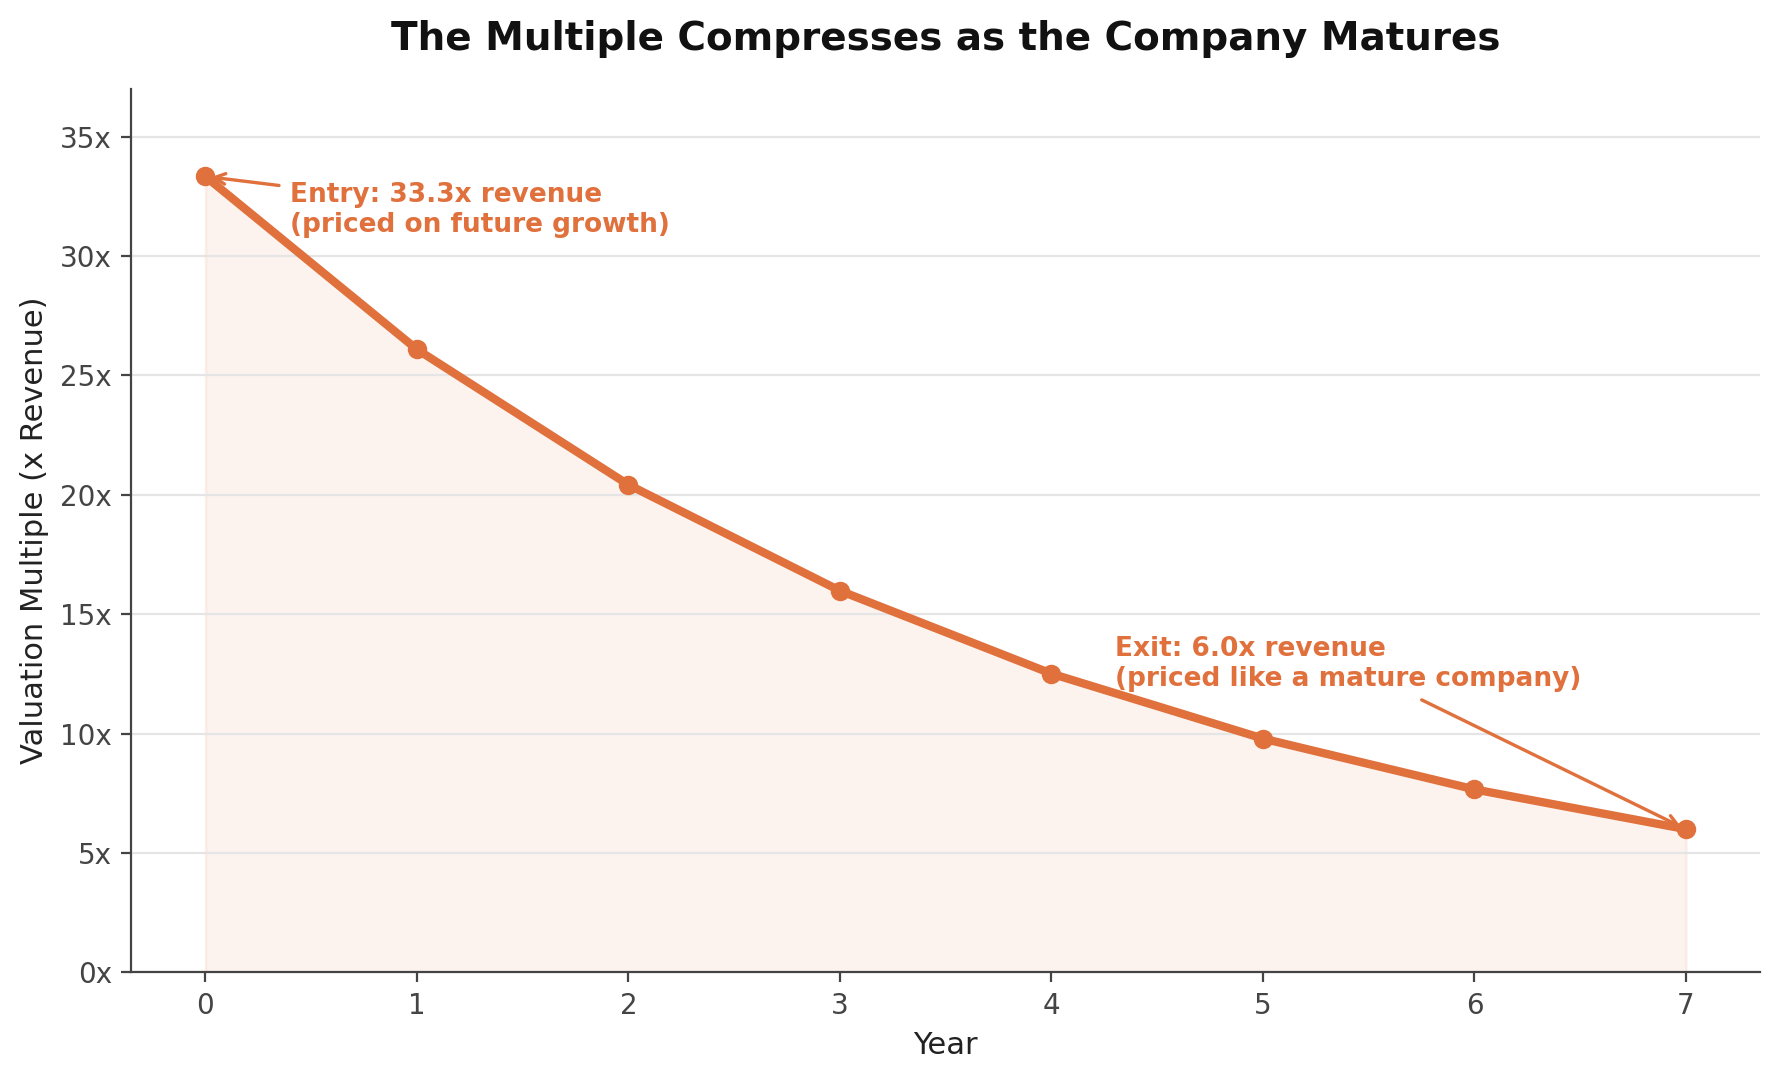
You can't value an early-stage company by asking "what are next year's profits worth", there usually aren't any profits yet. Instead, VCs value companies as a multiple of revenue, and that multiple itself changes over time:
Early on, investors pay a very high multiple of revenue (in this model, over 30x) because they're betting on explosive future growth, not on what the company earns today.
As the company matures, growth slows down, profits show up, and the market values it more like a normal, stable business, a much lower multiple (6x here).
The model bridges those two numbers smoothly over the years, so the "price" you effectively paid on day one connects logically to the "price" the company sells for at exit.
Takeaway for readers: when you see a startup valued at 30x revenue, it's not that the number crunches out to that, it's a bet that the multiple will look reasonable once growth catches up.
The two numbers that matter most for "did this investment work"
MOIC (Multiple on Invested Capital): simplest question of all, how many times your money did you get back? Put in $5M, get back $29M at exit → that's roughly 5.9x.
IRR (Internal Rate of Return): MOIC alone doesn't account for time. Getting 6x back in 3 years is a much better outcome than getting 6x back in 15 years. IRR converts your multiple into an annualized growth rate, so you can compare it against other investments (stocks, real estate, other deals).
Why the business flips from losing money to making money
Two growth rates are racing each other:
Revenue grows fast early (this model assumes it doubles some years), then slows as the company matures.
Costs (hiring, marketing, product) also grow, but consistently more slowly than revenue.
Once revenue's growth rate has compounded past costs' growth rate for long enough, the company crosses into profitability. That crossing point is the bottom of the J finally turning upward.
Five things this model deliberately simplifies (worth knowing if you build your own)
One investment, one exit. Real venture deals usually involve follow-on rounds over several years.
Ownership stays fixed. In reality, each new funding round usually dilutes earlier investors unless they keep reinvesting.
Value is proxied by a revenue multiple, not a full valuation analysis (comparable companies, discounted cash flow, etc.), a reasonable shortcut for teaching purposes, not for a real deal memo.
IRR is calculated the simple way, one lump sum in, one lump sum out, rather than accounting for cash flows happening at multiple points in time.
No probability of failure is baked in. Most real VC portfolios assume many investments will go to zero; this model shows one that succeeds.
The one-sentence takeaway
A VC valuation model is really just three questions asked in sequence: how much will this company likely be worth later, how does that turn into what my stake is worth, and how does that compare to what I originally put in. Everything else is bookkeeping to make those three answers trustworthy and easy to stress-test.