A Moving Average Crossover Strategy
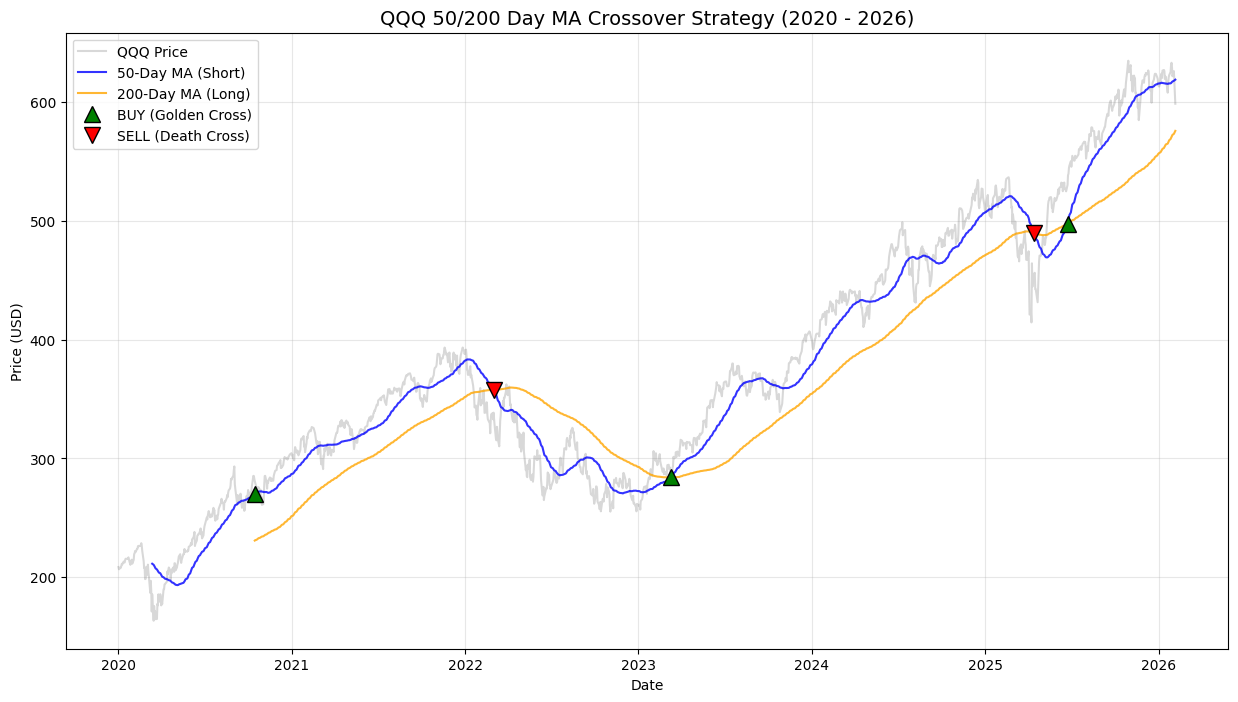
This is called a moving average crossover strategy or graph. We use this to determine buy and sell points. Mainly buy points though, when you sell you end up paying short or long term capital gains which no one likes, it is usually better to just ride it out and not sell. It is great to use though if you have new capital on the table, it can help you determine if it is a good time to buy or sit in cash/treasuries. When the 50 day simple moving average crosses above the 200 day long term simple moving average that triggers a buy signal. When the 50 day simple moving average crosses below the 200 day long term simple moving average that triggers a sell signal. It is a great informational tool to use. As you can see from the graph it would have been helpful over the last six years.
You do not have to follow it exactly, for example, last year during the liberation day tariff sell offs I would have bought if I had capital on the table. Events like that do not come around often. I find this tool useful when looking over a multi year period. You can see how accurate it was, the trend of the market, and how price moved over time during different macro environments. Take 2022 for example, if you were a trader or someone that doesn’t mind buying and selling out of their portfolio that would have been a good environment to sell in. We had run a way inflation and the fed was raising interest rates then. None of the tools I use do I say “because X said this, we are trading or buying/selling this”. I use a combination of all the information that is available to me to make investment decisions.